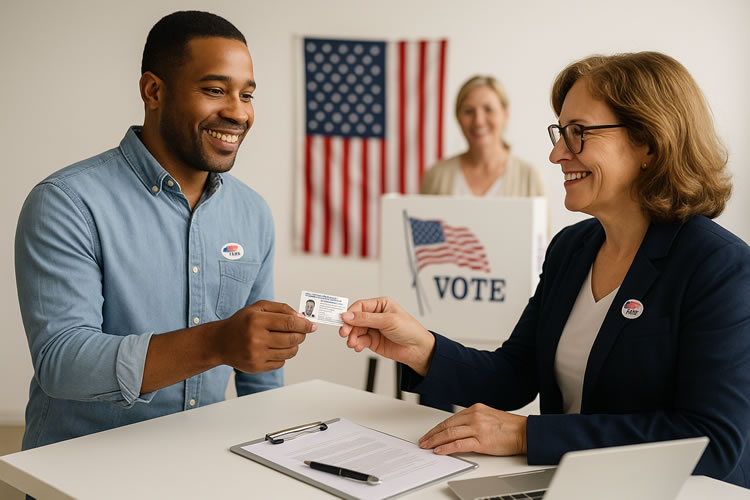
Vermont’s top Democrats—including Rep. Becca Balint, Sen. Peter Welch, Sen. Bernie Sanders, and Secretary of State Sarah Copeland Hanzas—have all voiced opposition to President Donald Trump’s proposal to require photo identification for federal elections. With the debate reignited, let’s examine the numbers behind voter ID laws to see what the evidence actually shows. Do they secure democracy or suppress it? The answer lies less in slogans than in the statistics—and those numbers tell a more nuanced story than the talking points.
The Brennan Center’s 21 Million Claim
The most widely cited criticism of voter ID laws comes from the Brennan Center for Justice, a progressive think tank at NYU Law. In 2006, they conducted a telephone survey of 987 respondents. Eleven percent said they did not have a “current, unexpired government-issued photo ID.” Scaled up, that produced the headline figure: 21 million Americans without ID.
The survey’s breakdowns made the disparities appear stark: roughly 25 percent of Black respondents, 16 percent of Hispanics, and 8 percent of whites said they lacked valid ID. But those figures came from very small subsamples. For example, only about 100 Black respondents were surveyed—so the “25 percent without ID” amounted to about 25–30 people. From there, the number was extrapolated into millions.
The survey also cast a wide net. Respondents weren’t asked if they were registered to vote or regular participants. Expired licenses counted as “no ID,” even though renewal is straightforward. Passports, tribal cards, or military IDs were inconsistently captured. In short, the “21 million” estimate was a theoretical maximum, not a direct measure of likely voters barred at the polls.
What the GAO Found in Practice
If one in ten Americans truly lacked valid ID, strict voter ID laws should have caused dramatic turnout drops. But when the Government Accountability Office (GAO) studied the issue in 2014—under President Obama—it found something very different. Looking at Kansas and Tennessee after they implemented strict ID requirements, the GAO found turnout fell by 2–3 percentage points relative to comparable.
That decline was most noticeable among young and African American voters, but nowhere near the double-digit collapse that the Brennan Center’s extrapolation would predict. The GAO’s report, conducted by a nonpartisan federal watchdog, suggested that the real-world impact of ID laws was measurable but modest.
The GAO also reviewed ten separate studies of ID possession and found that most registered voters already had valid identification—about 85 percent of whites and 81 percent of Blacks—far higher than the Brennan Center’s claim that a quarter of Black citizens lacked ID. Unlike the Brennan survey, which asked all adults about ID ownership, the GAO’s review focused specifically on registered voters, making its findings far more relevant to election participation. In practice, anyone registering to vote has already presented identification, so those without valid IDs are more likely dealing with expired licenses or similar technicalities rather than a complete lack of documentation.
The 2019 – 2022 Reality Checks
More recent elections reinforce that point. In Georgia, after the state enacted its Election Integrity Act in 2021, early voting surged by over 200 percent in the 2022 primary, and overall turnout remained high in both the general and runoff elections. Surveys found 99 percent of Georgia voters reported no problems voting, and more than 90 percent said it was easy. Whatever the law’s other controversies, mass disenfranchisement was not the outcome.
National studies have reached similar conclusions. A 2019 National Bureau of Economic Research paper found no evidence that voter ID laws reduced turnout overall. In fact, in some states Hispanic turnout increased. Heritage Foundation researchers, using the same data, pointed out that turnout effects, when they exist, are typically within the margin of error.
🍁 Make a One-Time Contribution — Stand Up for Accountability in Vermont 🍁
Turnout Trends
Election turnout trends further undercut the idea of mass disenfranchisement. If millions were truly blocked, turnout should have collapsed in ID states. Instead, turnout has been historically strong:
- 2008 (Obama’s first run): 61.6% — one of the highest rates since 1960.
- 2016 (Trump vs. Clinton): 60.1%.
- 2020 (Trump vs. Biden): 66.6% — the highest in more than a century.
- 2024 (Trump vs. Harris): 64.1% — slightly lower than 2020, but still historically highorigarticle.
Rather than seeing steep declines, American elections have drawn record numbers of voters even as many states adopted or enforced voter ID rules.

Rejected Ballots: The Hidden Problem
Where voters are more likely to lose their voice is not at the front door of the polling place, but at the back end of ballot processing—particularly with mail voting. Consider the rejection rates:
- 2016: 31.9 million mail ballots; 318,000 rejected (~1%).
- 2020: 70.6 million mail ballots; 561,000 rejected (~0.8%).
- 2024: 48 million mail ballots; 584,000 rejected (~1.2%)origarticle.
Even at rates under 1–1.2 percent, this means hundreds of thousands of ballots are discarded in every cycle, often for technical reasons like late arrival, signature mismatch, or improperly filled bubbles. Unlike the hypothetical 21 million disenfranchised in the Brennan Center’s model, these rejections are documented, measurable, and large enough to swing close races.
Protection Versus Suppression
Critics frame voter ID as suppression; supporters frame it as protection. Both perspectives matter, but one is often left out of the conversation. ID laws do not only guard the system against impersonation fraud—they also protect the individual voter. If Joe Smith shows up at the polls with his driver’s license, the system ensures it is his ballot that gets counted, not one fraudulently submitted in his name.
Mail-in voting complicates this picture, since ID checks are typically replaced with signature verification. If a fraudulent ballot arrives first and passes inspection, the real voter’s ballot may be flagged as a duplicate and rejected without the voter ever knowing. That risk doesn’t prove widespread fraud, but it does show why some see photo ID as a basic safeguard for protecting legitimate participation.
The Bottom Line
The Brennan Center was correct that some Americans lack ID, but its extrapolated “21 million” figure was built on a tiny survey and inflated through broad assumptions. The GAO’s independent research and years of actual election results show that strict ID laws produce only modest turnout effects, not the mass disenfranchisement claimed. Meanwhile, each presidential election quietly discards half a million or more ballots due to rejection—a much more concrete integrity issue.
Trump’s proposed executive order has stirred a partisan storm. But step back from the slogans, and the evidence points to a simpler truth: voter ID laws may impose a minor hurdle for some, but they have not prevented record participation. Instead, they may serve a larger purpose—ensuring that every legitimate voter’s choice is protected, and that lawful ballots are not canceled out by unlawful or invalid ones.
Dave Soulia | FYIVT
You can find FYIVT on YouTube | X(Twitter) | Facebook | Instagram
#fyivt #VoterID #ElectionIntegrity #VotingRights
Support Us for as Little as $5 – Get In The Fight!!
Make a Big Impact with $25/month—Become a Premium Supporter!
Join the Top Tier of Supporters with $50/month—Become a SUPER Supporter!


Leave a Reply