

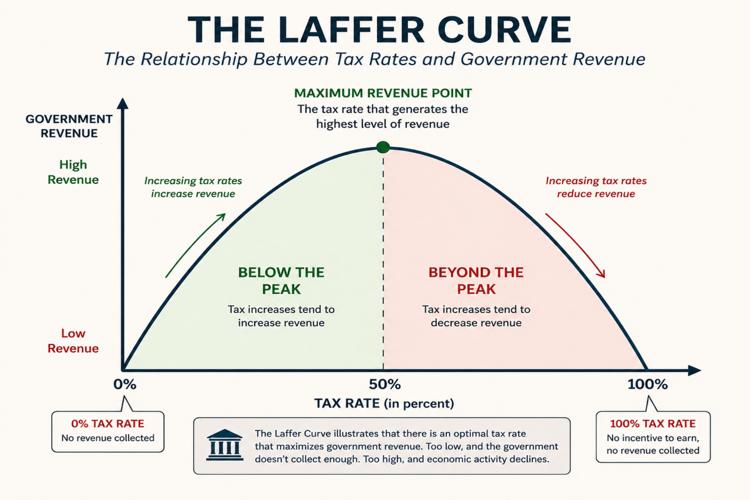
The Laffer Curve is an economic concept used to describe the relationship between tax rates and government revenue. It is often presented as a simple idea: there is some level of taxation that maximizes how much revenue a government can collect, and pushing tax rates beyond that point can actually reduce total revenue.
The concept is typically illustrated as a curve shaped like an upside-down “U.” At one extreme, a tax rate of 0 percent produces no revenue. At the other extreme, a tax rate of 100 percent—where the government takes all income—also produces little or no revenue, because there is little incentive to work, invest, or report income. Between those two points lies a peak where revenue is highest.
That peak is the core of the Laffer Curve: the idea that tax policy has limits, and that higher rates do not always translate into higher collections.
Where the Idea Came From
The Laffer Curve is named after economist Arthur Laffer, who popularized the concept in the 1970s. The story often told is that Laffer sketched the curve on a napkin during a discussion about tax policy. While the underlying idea—that excessively high taxes can discourage economic activity—has been around for centuries, Laffer helped bring it into modern political and economic debate.
The concept gained prominence during the 1980s, particularly in the United States, where it became associated with supply-side economics. Policymakers used it to argue that lowering tax rates could, under certain conditions, lead to increased economic activity and potentially offset some of the lost revenue.
How the Curve Works in Practice
The Laffer Curve depends on a key assumption: people change their behavior in response to taxes.
As tax rates increase, individuals and businesses may:
- Work fewer hours or reduce productivity
- Shift income into tax-advantaged forms
- Delay or cancel investments
- Relocate to lower-tax jurisdictions
- Engage in tax avoidance or evasion
These behavioral responses shrink the “tax base”—the total amount of income or activity being taxed. If the tax base shrinks faster than tax rates rise, total revenue can fall.
This is why the curve is not just about tax rates, but about how those rates interact with real-world decisions.
The Central Disagreement
While the basic shape of the Laffer Curve is widely accepted, the critical issue is where a given economy sits on that curve.
There are two broad interpretations:
- One view holds that many governments operate on the left side of the curve, where tax rates are relatively low. In this range, increasing tax rates tends to increase revenue, even after accounting for behavioral changes.
- The other view argues that some tax systems—particularly those with high marginal rates or heavy burdens on mobile capital—may already be on the right side of the curve. In that case, further increases in tax rates could reduce revenue.
The challenge is that there is no universally agreed-upon method for identifying the peak of the curve in a real-world economy. Estimates vary widely depending on assumptions about labor behavior, capital mobility, enforcement, and economic structure.
Evidence From Policy Experiments
Attempts to apply Laffer Curve reasoning in public policy have produced mixed results.
In the United States during the 1980s, federal tax rates were reduced significantly. Government revenue did increase in absolute terms over time, but so did budget deficits. Economic growth, inflation, and population changes complicate any direct link between tax cuts and revenue gains.
More recent examples, such as tax cuts in Kansas during the 2010s, showed a clearer outcome: revenues declined significantly, leading to budget shortfalls and eventual policy reversals.
At the same time, several high-tax countries in Europe continue to generate strong and stable revenue. These cases suggest that higher tax rates do not automatically push an economy past the peak of the curve.
Taken together, the evidence indicates that the Laffer Curve is not a one-size-fits-all rule. Outcomes depend heavily on local conditions.
What Determines the Shape of the Curve
Several factors influence where the peak of the Laffer Curve might lie:
- Mobility of taxpayers and capital: In regions where people and businesses can easily move, high taxes may lead to outmigration and revenue loss.
- Type of tax: Income taxes, corporate taxes, and consumption taxes affect behavior differently.
- Tax enforcement: Strong enforcement can limit avoidance and keep the tax base stable.
- Economic structure: Economies reliant on high-income earners or specific industries may be more sensitive to tax changes.
- Cultural norms: Compliance levels vary depending on public trust and attitudes toward taxation.
Because these factors vary widely, the “optimal” tax rate is not fixed and cannot be universally applied.
What It Means for Policy Discussions
The Laffer Curve is best understood as a framework for thinking about trade-offs rather than a precise policy tool.
It highlights a simple but important point: tax policy affects behavior, and those behavioral responses matter for revenue outcomes.
However, it does not provide a clear answer to where tax rates should be set. Claims that tax cuts will always increase revenue—or that tax increases will always do so—go beyond what the concept can reliably support.
For policymakers and the public, the value of the Laffer Curve lies in its ability to frame the question correctly: not just how much to tax, but how taxation shapes economic activity.
Why the Debate Continues
The persistence of the debate reflects the difficulty of measuring real-world behavior. Economies are complex, and isolating the effects of tax policy from other variables—such as economic growth, demographic shifts, and external conditions—is challenging.
As a result, the Laffer Curve remains both widely cited and widely contested.
It provides a useful language for discussing taxation, but its application depends on evidence, context, and careful analysis rather than simple assumptions.
1 Comment