

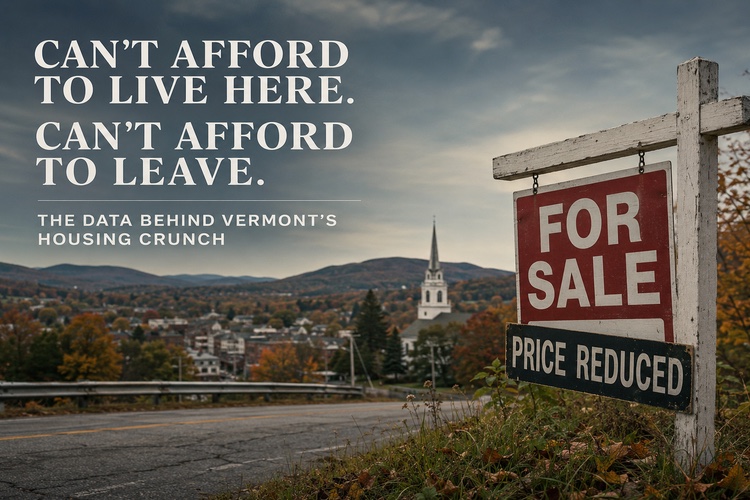
A friend noticed more for-sale signs. He's right — inventory is up. But the data says the "stampede out of Vermont" lives in what people want to do, not yet in what the market is doing. Here's the whole machine, from the signs on the lawn to the money underneath.
The signs are real — but it's a thaw, not a fire sale
Vermont's active listings climbed from about 1,735 in February to 2,408 in June — roughly +12% year-over-year. More signs, yes. But prices are still rising, supply is still below a balanced market, and well-priced homes still go under contract in about two weeks. That's a partial thaw off a historic low, not people fleeing.
Active listings are climbing off a historic low
Vermont single-family + condo active listings, 2026 (Realtor.com / FRED)
🍁 Was this worth reading?🍁 Keep Vermont news free.
Two-thirds of young Vermonters want out
The desire to leave is overwhelming and measurable — and concentrated in exactly the working-age people the state needs. The actual net departure is still modest, and most of Vermont's population loss is demographic (an old state with few births), not flight. But the leading indicator points one way.
“Likely to leave within 5 years,” ages 18–34
Share of young adults, by state — UNH Survey Center, July 2026
Why Vermont's population fell ~1,900
Components of change, year ending mid-2025 (U.S. Census / Vermont Public)
Below-average wages, above-average everything
Vermont workers earn ~15% less than the national average while paying ~12% more to live — yet homes cost as much as anywhere. The state's income stats look fine only because non-wage money (investment income, pensions) props up the average. The people working for a paycheck are underwater.
| Metric | Vermont | United States | VT vs US |
|---|---|---|---|
| Typical home value / median sale | ~$400,000 | $396,173 | ≈ even / above |
| Average weekly wage | $1,243 | $1,459 | −14.8% |
| Per-capita personal income | $74,580 | $76,393 | −2.4% (21st) |
| Cost-of-living index | ~112 | 100 | +12% |
| Home price ÷ avg worker wage | ~6.2× | ~5.2× | worse |
| Real wage purchasing power | earn 15% less × pay 12% more | ≈ −24% | |
The distortion: wages sit 14.8% below national, but per-capita personal income only 2.4% below — the gap is investment and retirement income from an older, wealthier, equity-rich population. Vermont looks average because retirees and asset-holders lift the average; wage-earners don't feel it.
Where the “12% above” actually bites
Vermont cost-of-living components, index vs U.S. = 100 (Salary.com, 2026)
Why the trap holds — and who built it
Every major lever routes benefit to incumbent, land-rich, higher-turnout owners and routes cost onto renters, the young, and the towns frozen out. None of it requires a villain — just adverse incentives a same-party supermajority has little reason to unwind.
“Affordable” housing now costs half a million dollars a door
Average public per-unit development cost for affordable rentals (VHFA / Vermont Public)
Vermont spent $789M on housing (2020–2024) to produce ~2,249 new homes plus rehabs. Subsidize demand, strangle supply, and you manufacture $600k “affordable” units on multi-decade covenants.
The education-cost engine
The fixed labor base behind the property tax
| Per-pupil spending | $24,050 |
| National rank | 2nd (+77% vs US) |
| Enrollment since 2000 | −20%+ |
| Students per teacher | 10.5 (US 15.4) |
| School employees | 1 per 4.6 students |
Enrollment collapsed; staffing didn't. The cost lands on the property tax — a levy on the asset that hits fixed-income elders and, via non-homestead rates, renters.
The hidden tax shifts FYI VT reporting
How the price signal gets anesthetized
| Current Use subsidy / yr | $70–80M |
| — falling on the education fund | ~$55M |
| FY2027 ed-tax “headline” | 7% |
| — real, without one-time money | 10–12% |
| One-time props used | $104.9M + $22M |
Current Use shifts burden onto homesteads & small business (owners can even post the land against public access). The tax “relief” rests on one-time cash — a senator's words: “kicking the can down the road.”
Act 181: the state demands homes, then maps them off-limits FYI VT reporting
Land-use designation by county — Rutland's draft maps, and who got the growth
Across the Rutland Region, draft maps push “Rural Conservation” from 41% to 58% of the county — 17 of its 27 towns now over half conserved, Mount Tabor at 98.9% — while the growth footprint stays essentially flat (6.6% → 6.3%) and owners keep paying tax at full development value they can no longer realize. And the growth that is allowed tracks wealth: Chittenden County supplied ~⅓ of the yes votes and >10% growth-eligible land; the Northeast Kingdom got under 1%. Procedural democracy occurred; distributive justice did not.